
I am beating the same drum as usual here. First I lecture that you should define a problem before fixing it, now I am saying you should measure it before fixing it. You probably wonder if I actually ever get to fixing the damn problem. The answer of course is yes. Can you fix a problem without measuring it? Yes, people do it every day or at least attempt to do it. I caution against this approach because you don’t give yourself a baseline to compare progress to after you are done. How do you say, “This project or new concept is a total success!” without doing some type of measurement? The next question is how do you measure and what do you measure?
Measurement in Public Housing:
Measuring can come in many ways and many forms. You can look at staff hours used to complete a task and then easily turn that into staff dollars. You might look at wasted steps, wasted materials or maybe something really specific like number of defects per 100 or 1000. If you are in maintenance and want to measure a problem related to inventory, you might be looking at what items are coming up out of stock the most. You can take this approach to narrow your focus. How about if you are in community services? Yes job placements might be the key indicator but if you are trying to improve the process are there other indicators you need to be measuring? Are you well equipped to even measure them?
Tools for Measuring:
Value Stream Mapping: I am not going to bore you with another explanation of process mapping. Simply said, I am a fan and it lets you lay out the process or issue in question in a sequential manner. Once you can do this, you are free to add associated time values and designate parts of the process value added vs. non value added. See link-http://wp.me/p4QVqd-6t
Gage R&R–

This step is basically ensuring that your measurement systems are in order and that the data you will collect is solid. You should run at least a few simple tests to ensure both the repeatability of your data. You need to ensure the system is giving you consistent results and that if someone else measures the data using the same system that they can also reproduce the same results.
Spaghetti Diagram:
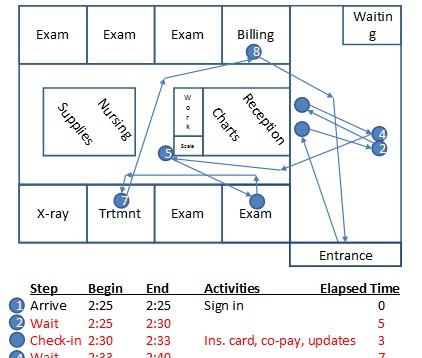
I like this tool for looking at wasted steps in a warehouse and or the work place. You can see what type of environment is present in these various scenarios. Are workers in a warehouse running from one side of the building to the other to get tools, do work and or find goods? If they are spending an inordinate amount of time moving instead of working, this tool will help you capture it. Same idea in the office. If your staff is running to the printer every 5 minutes you can capture this and assign times and trips. This might help you to decide if your office environment is as lean as it needs to be. See below for some ideas on how to do this.
Go to the place where the work is done. Start at the beginning of the process and use directional arrows on a piece of paper to record movement. Capture everything even if it becomes cluttered. This will give you the true nature of what is happening. Record the time of all of these movements. Make sure you record where work stops or where someone stops to do something or pick something up or move materials. Think about major tools and materials and record them within the diagram and how often time is being spent there.
Do not leave out any flow movement even if the paper becomes cluttered and difficult to follow. This probably indicates opportunity. Most often, the perceived unusual flow, or “exceptions”, are actually happening more often that is realized. Capture these! Make sure you document who is involved, the dates, times ect. Calculate the time, distances, starts, stops and other information at the end of the process to understand baseline measurements. Talk with staff and management to come up with possible ideals to streamline the placement of materials to cut back on movement that is not unnecessary.
Data Collection: While the other ideas listed are some tools, basic hard data collection is best done by first creating a data collection plan. Decide what you need, who is going to collect it and where it is going to come from. Here are some examples of past projects I worked on at housing authorities.
- Interim Review Improvement: Data Collected-Number of interim requests in Section 8 department per month
- HR Interview Process: Data Collected: Length of time to hire a new employee-separated by management and non management.
- Annual Review Process; Time it takes to do annual review, number of annual reviews per month, average Section 8 case worker salary, average hourly cost of an annual review, cost of postage per annual review, total cost of an annual review
- Maintenance Work Order Project: Numbers regarding how many work orders were completed per tech per month. I tried to get last months of information to give me a good data set. I also tried to get the number of billed hours per tech and did the same for the various trades.
- Procurement: I did not do a procurement project but a friend of mine did at another housing authority. They measured the number of days it took to procure good in general but also broke out different types of goods and services by under $5,000 between $5,000-$10,000 and a few other larger categories.
These are just some ideas to show that measuring before a project does not have to be complicated. The next question is what do you do with this information?
Project Completion: You started this project because you saw a flaw or a reason to try improving. You measure at the start to see how bad the problem is. Now when you finish, go ahead and compare the new numbers to the numbers after project completion. If your project did what you thought, you should have some serious bragging going on. Having the hard data will give you the right to show that you and your team just did some damn good work. If you find the improvement is not having the desired effect, go back and look at your original cause and effect diagrams to see what other issues may be causing your problem. The main thing here is that you have the measurements that allow you to see if your project is successful or not.

Leave a comment